
Events in Las Vegas – October 2019
October 1, 2019
Events in Las Vegas – November 2019
November 4, 2019Las Vegas Real Estate Market Update – October 2019


Las Vegas Real Estate Market Update – October 2019
Welcome to the October issue of my monthly market update for Southern Nevada. In this issue I will be going over September 2019 numbers.
More than 13 years after the market peaked, Las Vegas house prices last month came close to their pre-recession highs.
But the $5,000 gap is bigger than it appears: When adjusting for inflation, prices remain a long way off from those of the bubble days.
Las Vegas was ground zero for America’s real estate bubble in the mid-2000s, marked by fast-growing property values, booming construction and widespread home flipping.
According to the GLVAR, the median price of a single-family house peaked in June 2006 at $315,000, which, adjusting for inflation, is about $398,300 today – around $88,300 above last month’s median.
Southern Nevada was also ground zero for America’s housing crash during the Great Recession, with sweeping foreclosures, plunging property values and numerous abandoned real estate projects.
The median sales price of a single-family house hit bottom in January 2012 at $118,000, according to the GLVAR – a 62.5% drop from the peak.
Market Trends
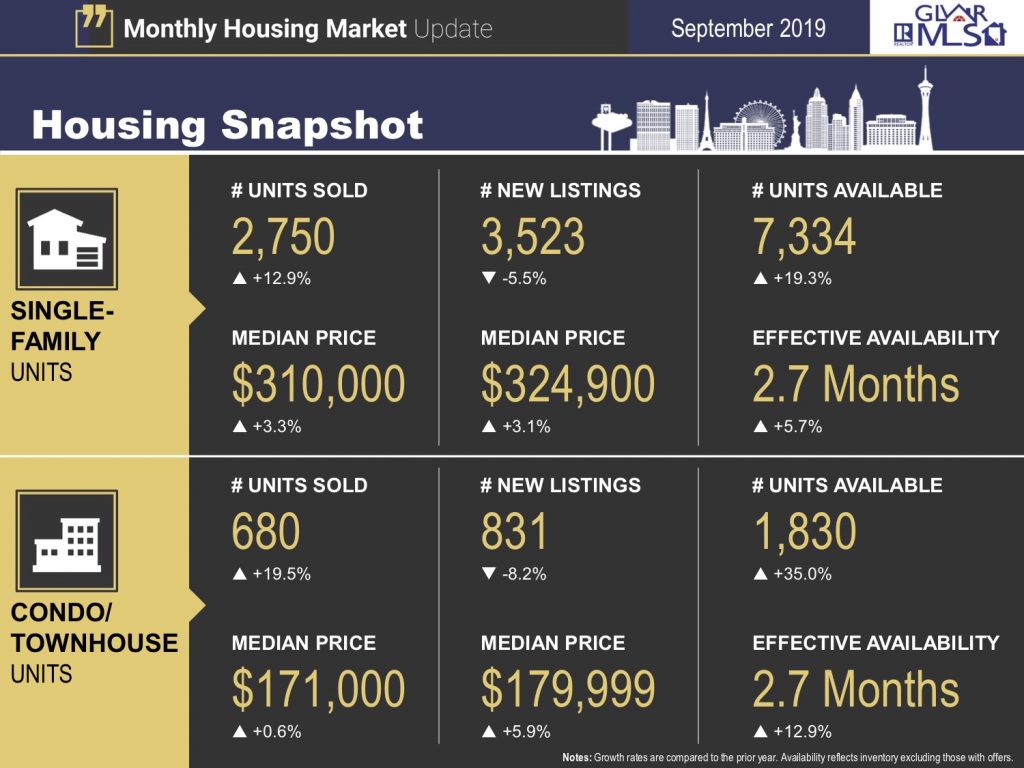
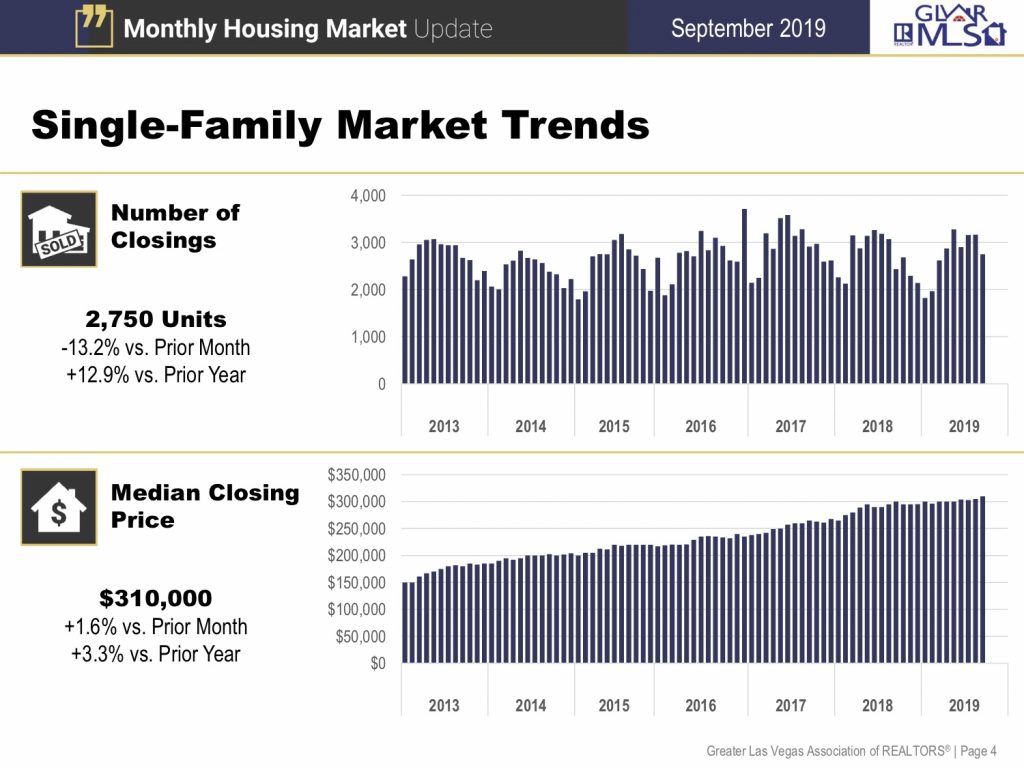
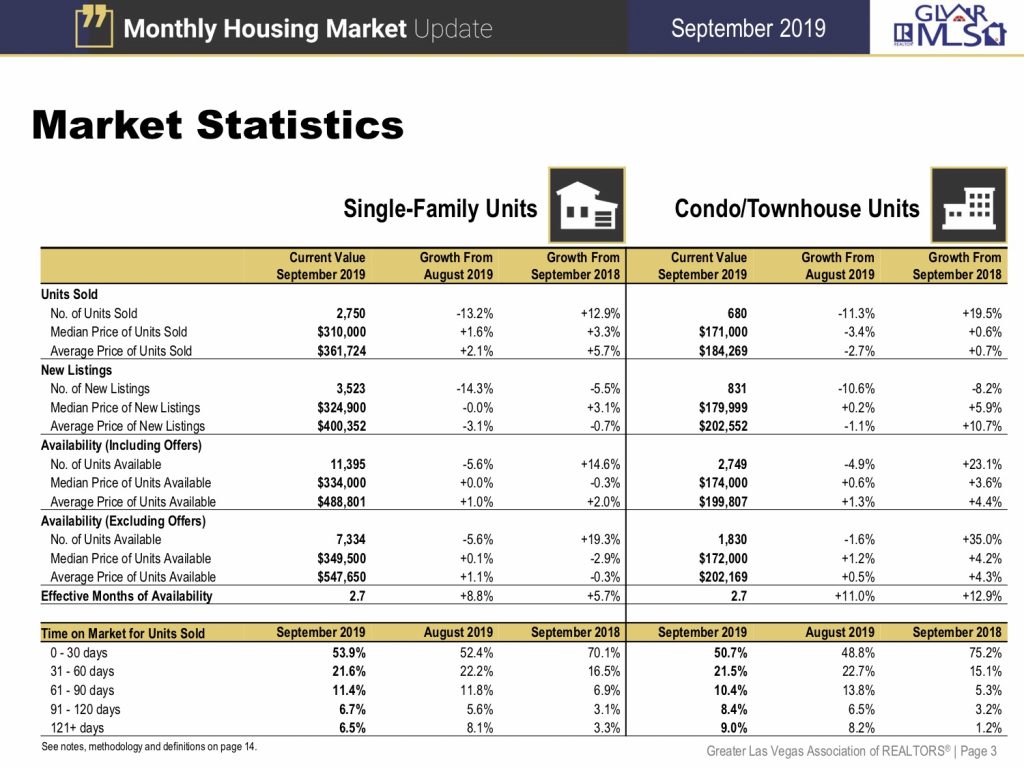
So, what was the actual Median sales price for last month? The median sales price of previously owned single-family homes, which always compromises the bulk of the market, was $310,000 in September, up 1.6% from August and up 3.3% from September 2018, according to a new report from the Greater Las Vegas Association of Realtors.
According to the GLVAR, there were 2,750 single-family houses that sold in September, down 13.2% from August, and up 12.9% from September 2019.
Market Trends
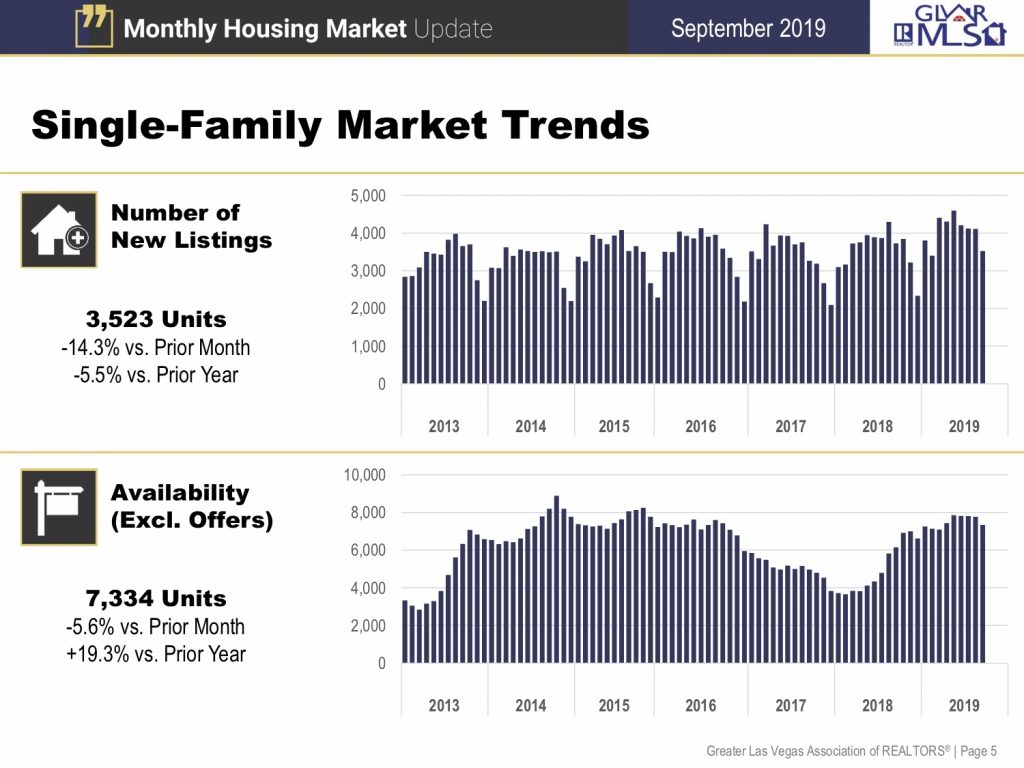
Southern Nevada also had a total of 3,523 new listings for the month of September, down 14.3% from August, and down 5.5% from the prior year.
However, there were a total number of 7,334 single-family houses listed without offers at the end of September, down 5.6% from August and up 19.3% from the prior year.
Market Trends
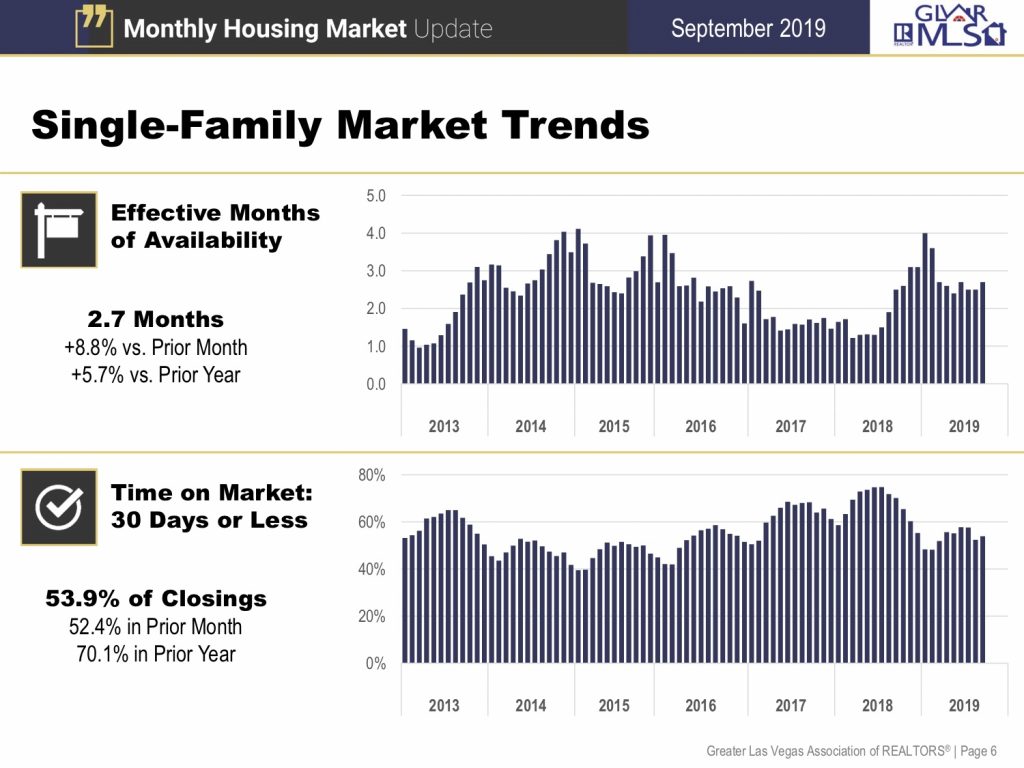
There is a 2.7 months housing supply in Southern Nevada, up 8.8% from August and up 5.7% from prior year.
So, what does “Months of Supply” mean? Months of supply is the measure of how many months it would take for the current inventory of homes on the market to sell, given the current pace of home sales. …
Months of supply is a good indicator of whether a particular real estate market is favoring buyers or sellers.
Typically, a market that favors sellers has less than 6 months of supply, while more than 6 months of supply indicates an excess of homes for sale that favors buyers. We are still in a sellers-market, but it is not as strong as it was from a year ago.
53.9% of the closings for the month of September was on the market 30 days or less.
Locally, home prices have been climbing for years, though after the market heated up in 2018 and sparked affordability concerns, things have cooled off this year.
Price growth has slowed, builders are selling fewer houses, and the once-shrunken tally of available listings has shot back up.
Resale prices aren’t the only aspect of the valley’s housing market that remains off from the bubble years.
Homebuilders closed around 10,670 sales in Southern Nevada last year, up from just 3,900 in 2011 but nowhere near the peak of almost 39,000 sales in 2005, according to Home Builders Research.
If you would like to download the full report provided by the Greater Las Vegas Association of Realtors, CLICK HERE.
I hope you have enjoyed my monthly market update for October 2019.
Also, if you are thinking about buying or selling in the Las Vegas Valley, I have provided a link to a form to fill out CLICK HERE or you can call me at 702-370-5112.
Subscribe to our YouTube Channel: http://bit.ly/
Angela O’Hare, Realtor
The O’Hare Team
Home Realty Center
702-370-5112
[email protected]
www.neighborhoodsinlasvegas.com


