
Ashland by Taylor Morrison
January 4, 2025
Top 10 Summerlin Villages in 2025
January 12, 2025Las Vegas Housing Market Update 2024 Year End Review


Las Vegas Housing Market Update 2024 Year End Review
Hey everyone, welcome back to my channel for our January 2025 monthly market update! I’m here with Rob, and today we’re diving deep into the latest housing trends and numbers for December 2024 in the Las Vegas Valley.
We’ll break down all the key stats for the year, including:
Median Home Prices 📊
Months of Supply 📉
Listings Sold Without Offers 🏡
But that’s not all—there will be a few special surprises along the way! 🎉
Find out where we landed in 2024, what the numbers say about where we’re headed in 2025, and (drumroll, please 🥁) who won last month’s bets between Rob and me!
It’s going to be an insightful, fun, and engaging show you won’t want to miss. Stay tuned, and let’s navigate the Las Vegas real estate market together!
MARKET TRENDS
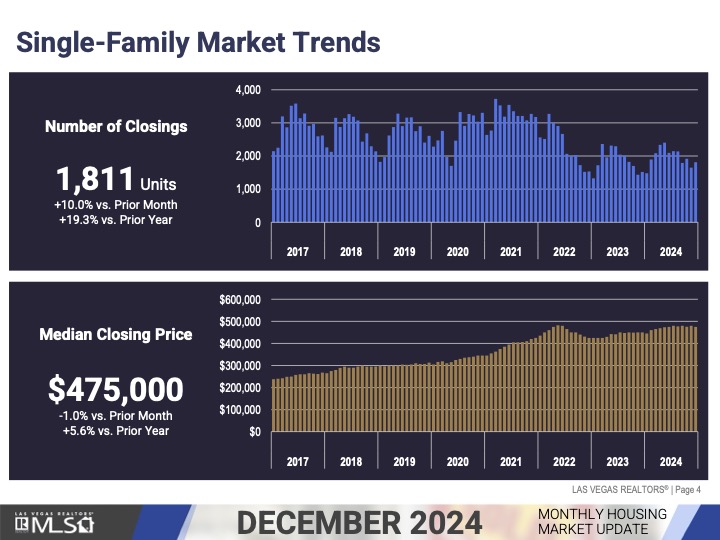
There were 1,811 single-family houses that sold in December, up 10% from November and up 19.3% from December 2023.
The median sales price of previously owned single-family homes, went from $480,000 to $475,000 in December, a $5,000 median price decrease; which is down 1% from last month, but up 5.6% from December 2023.
So, from December 2023 to December 2024, we had a $25,100 median price increase in single-family homes.
In December 2024, the median price of previously owned single-family homes was at $475,000.
In December 2023, the median price of previously owned single-family homes was at $449,900.
In December 2022, the median price of previously owned single-family homes was at $425,000.
In December 2021, the median price of previously owned single-family homes was at $425,000.
MEDIAN PRICE – 2024
January: $445,000
February: $460,000
March: $465,000
April: $469,000
May: $473,000
June: $475,000
July: $480,000
August: $476,875
September: $479,990
October: $475,531
November: $480,000
December: $475,000
In 2024 the median price in January was $445,000 and the median price in December was $475,000, which was a $30,000 GAIN in Median price from January 2024 to December 2024.
In 2023 the median price in January was $425,000 and the price in December was $449,900, which was a $24,900 GAIN in Median price from January 2023 to December 2023.
CONDOS
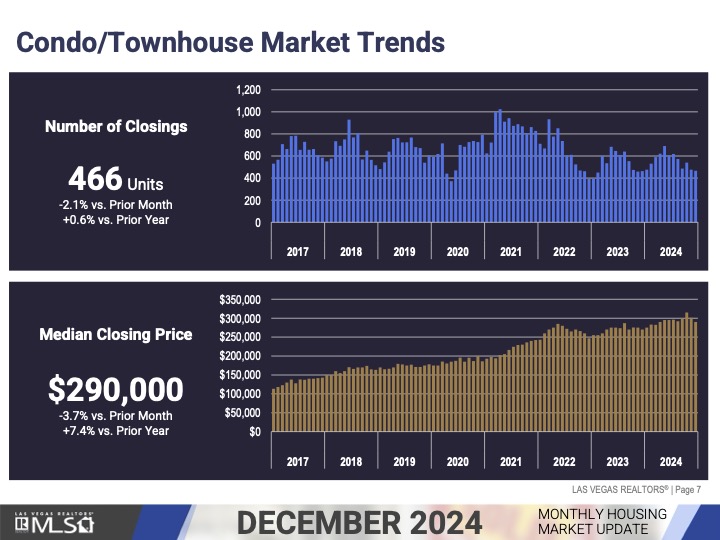
The median sales price of condos and townhomes for December went from $301,250 to $290,000 a $11,250 median price decrease; which is down 4.4% from October, but up 9.5% from the prior year.
So, from December 2023 to December 2024, we also had a $20,000 median price increase in condos/townhomes.
In December 2024, the median price of condos and townhomes was at $290,000.
In December 2023, the median price of condos and townhomes was at $270,000.
In December 2022, the median price of condos and townhomes was at $246,990.
In December 2021, the median price of condos and townhomes was at $242,000.
LUXURY MARKET
There were 147 homes that sold in December for $1 million and over, compared to November’s 108 homes, 39 home decrease.
The median sales price in the Luxury Market for December decreased to $1,350,000 and in November that number was $1,368,000. A $12,000 decrease in the median sales price.
MARKET TRENDS
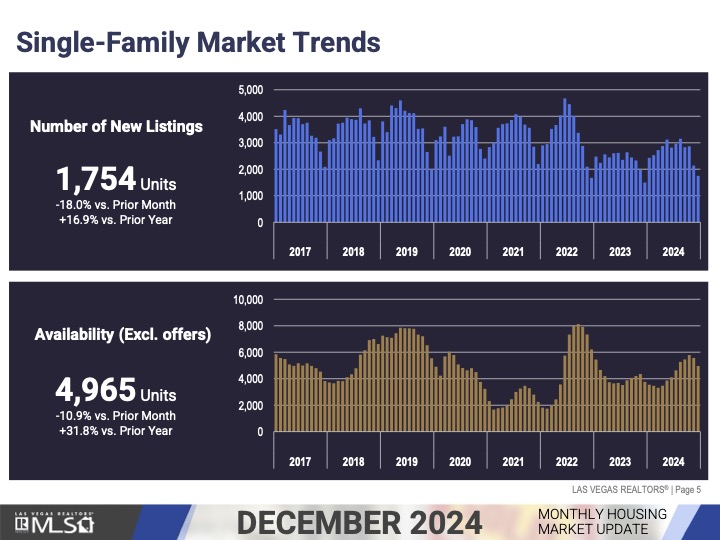
So, for December we had a total of 1,754 new listings, which is down 18% from November, but up 16.9% from the prior year.
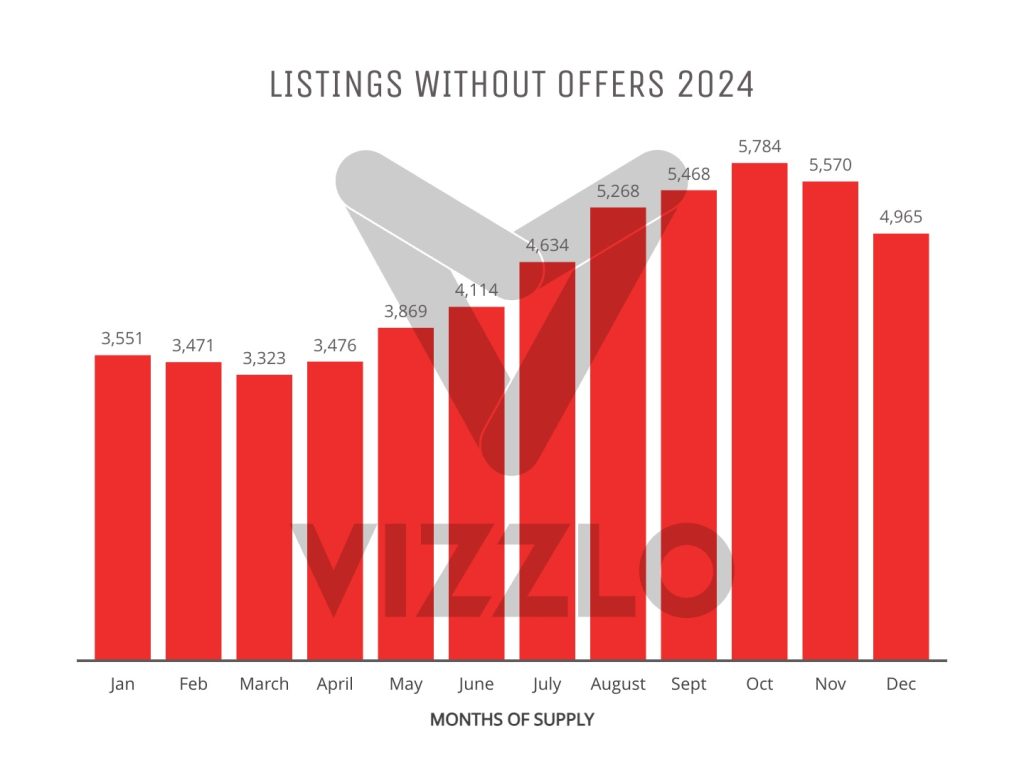
There were also a total number of 4,965 single-family houses listed without offers in December, which is down 10.9% from the previous month, but up 31.8% from the prior year.
December 2023 there were 3,766 single-family homes listed without offers, which is 1,199 less homes on the market in 2023 compared to this year.
December 2022 there were 6,211 single-family homes listed without offers, which is 1,246 more homes on the market in 2022 compared to this year.
LISTINGS WITHOUT OFFERS – 2024
January: 3,551
February: 3,471
March: 3,323
April: 3,476
May: 3,869
June: 4,114
July: 4,634
August: 5,268
September: 5,468
October: 5,784
November: 5,570
December: 4,965
MARKET TRENDS
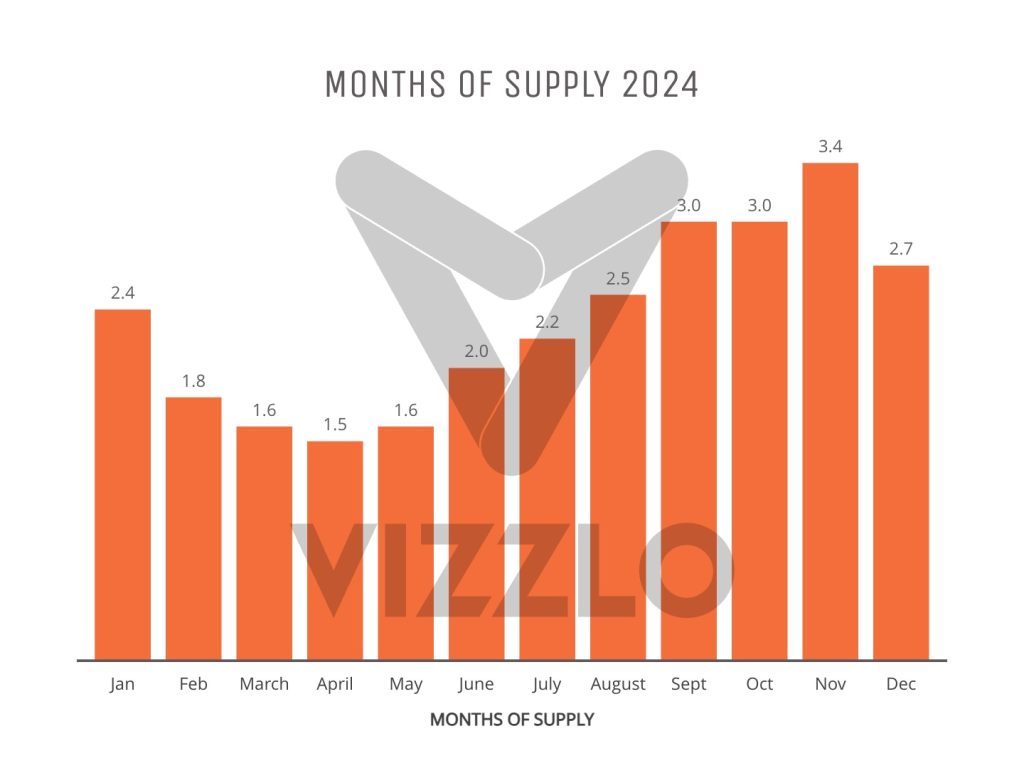
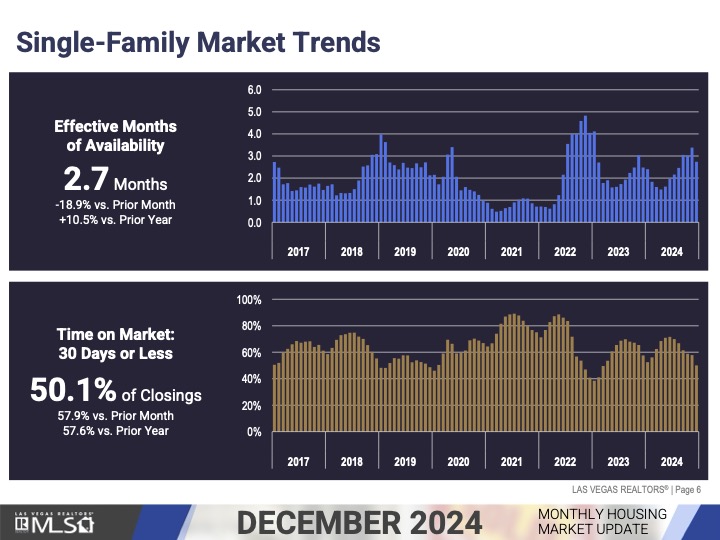
Which brings us to the housing supply in Southern Nevada, last month we are at 2.7 months of inventory on the market, in November we were at 3.4 months of inventory; which is down 18.9% from November, but up 10.5% from the prior year. (Slide #3)
December 2023 we were at 2.5 months of inventory on the market.
December 2022 we were at 4 months of inventory on the market.
MONTHS OF SUPPLY – 2024
January: 2.4
February: 1.8
March: 1.6
April: 1.5
May: 1.6
June: 2.0
July: 2.2
August: 2.5
September: 3.0
October: 3.0
November: 3.4
December: 2.7
50.1% of the closings for the month December was on the market 30 days or less, in November this number was at 57.9% and in December 2023, 67.6% of the homes were on the market 30 days or less.
INTERESTING NUMBERS
A total of 31,305 existing homes, condos and townhomes sold during 2024, according to the latest data from LVR. That’s nearly an 8% increase from the previous year when 29,069 houses, condos and townhomes sold. Notably, 2021 was a record year when 50,010 properties sold and 35,584 sold in 2022.
The total dollar value of sales during December was close to $1.1 billion for homes and more than $144 million for condos, high-rise condos and townhomes. Compared with one year ago, total sales values last month were up 27.7% for homes and up 4.9% for condos and townhomes.
TOP SELLING ZIP CODES FOR 2024
The ZIP code 89166, which makes up the southern part of Mount Charleston and the upper part of the northwest valley including some communities such as Providence, Skye Canyon and Kyle Canyon, sold the most homes in 2024, according to Clark County property records. Records show 1,528 single-family homes, 224 townhouses and 20 condos sold in the area (for a total of 1,772 homes) from the start of 2024 though Dec. 16.
Coming in second place is the 89141 ZIP code, which encompasses the southwestern tip of the valley and parts of Southern Highlands, southwest of Enterprise. Property records show 1,387 homes, 227 townhomes and zero condos sold in the area in 2024 through Dec. 16.
In terms of dollar value, leading the valley is the 89135 ZIP code, which includes Summerlin South and the prestigious guard-gated community of the Summit Club. A total of $1.2 billion in sales occurred in that ZIP code through Dec. 16 of 2024. That number includes $1 billion in home sales, $58 million in townhome sales and $82 million in condo sales.
Coming in second place for total value sold is the ZIP code of 89141, which is west of Interstate 15 and includes Enterprise, where $1 billion was sold over $92 million for homes, $90 million worth of townhomes and zero condos.
ROB & ANG BETS
MEDIAN SALES PRICE
Rob said $1,500 increase
Ang said $2,000 increase*
Actual # decreased by $5,000
NO ONE won this!
WITHOUT OFFERS
Rob said 5,350
Ang said 5,300
Actual # 4,965
ANG won this one!
MONTHS OF SUPPLY
Rob said 3.1 months
Ang said 3.2 months
Actual # 2.7 months
ROB won this one!
Las Vegas Realtors Report
If you’re considering buying or selling a home in the Las Vegas Valley, please don’t hesitate to reach out to me. I’ll get back to you personally and promptly. Thanks for visiting!
Subscribe to our YouTube Channel: http://bit.ly/YouTubeAOHare
Angela O’Hare
Favorite Las Vegas Realtor
REAL Broker LLC
Lic. #180246
702-370-5112
[email protected]
www.neighborhoodsinlasvegas.com


